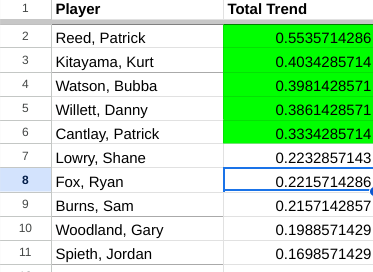
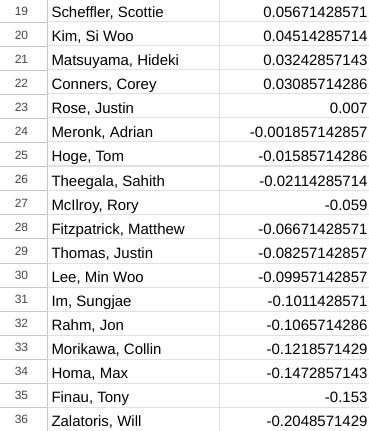
Trying something new this week. I’m not going to live and die by this analysis, but I think it’s interesting nonetheless. I’m taking certain trackable stats - mostly strokes gained, even if it can be an imperfect system - and trying to ascertain which trajectory a golfers game is on.
This is a simple table with a total trend score - I take the data point from the past 16 rounds and subtract it from the data point from the past 32 rounds. Say it’s Rory McIlroy and it’s SG: Approach. If he has 2 strokes gained over his last 16 rounds and 1 stroke gained over his last 32, he’d be positive 1 stroke gained in the category which means his game is on an upward trajectory so far as approach goes. Works the opposite as well, if it’s a negative number, it means that part of his game is trending down.
The goal of the table is to look at only the players in the player pool and see if there’s a noticeable trend between past 16 rounds and past 32 rounds. The score is an average of all stats used that week with specific round data that’s used for the model that determines said player pool. It shows us where the golfers game as a whole is going. That being said, this week’s trend table is listed below. I plan on using a quarter of a stroke in either direction to determine if I highlight green (good) or red (bad). If it’s still a white box, it means their game has stayed relatively consistent over that time period and there’s something to say about that as well - consistency in golf, especially if you’re a Scottie Scheffler, can be a great thing.
Discussion about this post
No posts


